
It’s here! The new Research Wizard Advanced Backtester and Screener ADD-ON is
now available
|
-
Automated Robustness Analysis
-
Combo Strategy (multi-strategy) Backtesting
-
Expanded Backtesting History
-
Backtest Status Window
(perfect for longer, more complicated backtest queries)
-
Downloadable Backtesting Database
(fully portable -- no internet access needed)
-
Combo Strategy Screener
|

|
|
('Best' Case / 'Worst' Case Analysis)
Backtesting is one of the only ways to see how successful your trading
strategies are BEFORE you place a trade.
And testing your strategies over many different time periods is critical to
making sure your strategies are robust enough to make money in all markets no
matter when you start using it.
|
For example: if your strategy is to buy stocks at the beginning of each month
and hang onto them for the remainder of the month; it’d also be a good idea to
see what would happen if you picked your stocks in the second week of the month
or the third week of the month etc., and held onto those picks for a different
set of four week periods. In other words, how does your strategy do if you buy
your stocks on the first week of the month and hold onto them until the last
week of the month. Or what would happen if you bought your stocks on the second
week of the month, and held onto them 'til the second week of the next month.
Or buying on the third week of the month ... etc.
This is good stuff to know.
Why? Because depending on when you run your screen, your strategy could pick a
different list of stocks. And this list might be slightly (or meaningfully)
different. And these different lists will be held over different sets of four
week periods.
|
|
|
So if your strategies can do well no matter what and when -- now you know you’ve
got something special -- a proven, profitable and repeatable way to pick
winning stocks.
While some of this can be done individually in the standard backtester in the
Research Wizard, the advanced backtester, lets you test your strategy over
multiple start dates with only one click of the mouse instead of setting up
separate tests for each new start date you want to test it over.
And in the advanced backtester, each new start date (and performance graph) will
be displayed on the same chart so you can easily see the difference between
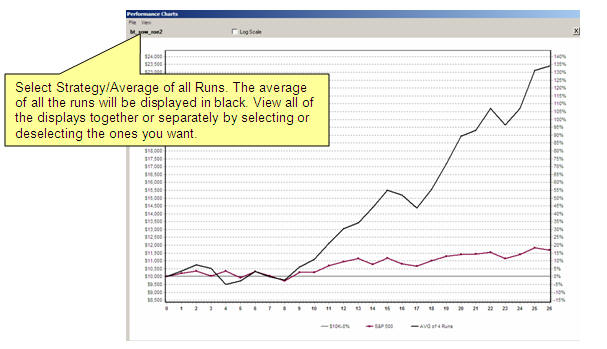
these different start dates. In addition to that, it’ll display the average
performance of the strategy using all of the tested start dates. (See below.)
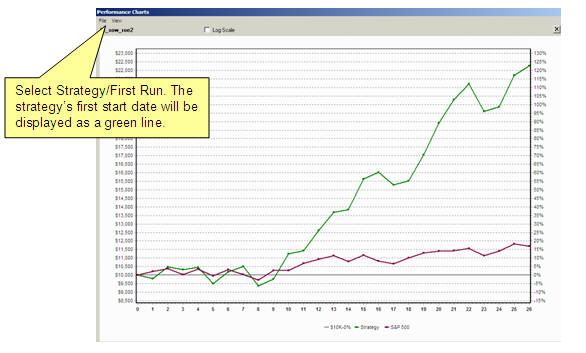
To view a particular run or
study, simply select (or deselect) the different studies on the View
Menu bar and the ones you want to zero in on will be displayed.
By selecting only the "Strategy/First Run" display, the performance chart of only the
first start date will be shown (along with the S&P 500).
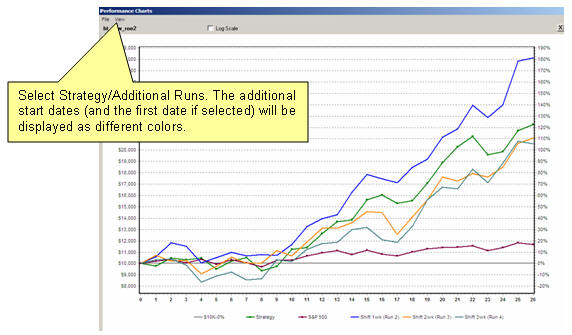
By then selecting the Strategy/Additional Runs display, the performance charts of all
the strategy's start dates will be displayed (along with the S&P
500).
You can also add the average of
all the runs ("Strategy/Average of All Runs") to your display
as well. Or you can isolate the average run and view that separately
(as in the image below).
|
In addition to the graphical displays of performance, a statistics table will
appear for each start date along with a Summary Table (image to the right)
showing the average performance of your strategy and the best and worst stats
and run they’re attributed to.
Testing and evaluating the success of your stock picking ideas has never been
easier. And that means making more money.
|
|
|
One of the most exciting features of
the Advanced Backtester is being able to backtest Combo Strategies.
If that sounds like what you think it is, you’re right. Now you can
backtest multiple strategies together!
|
Want to see how some of our most popular strategies perform together as a
portfolio? Will one compliment the other? Will the returns be even higher
together? Less risk? Find out instantly.
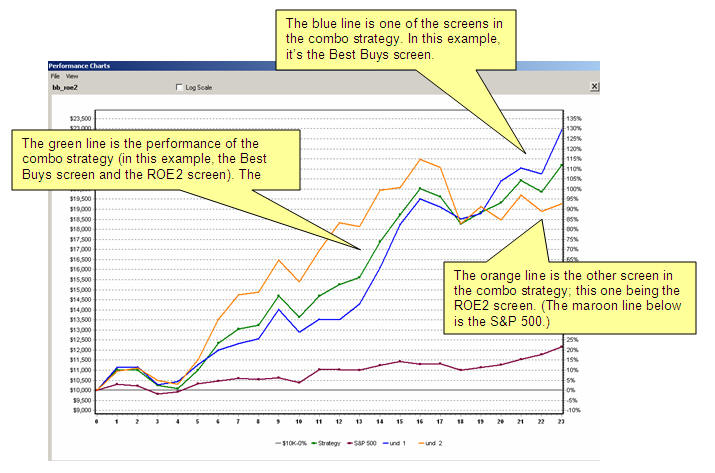
Create a Combo Strategy by simply combining two or more strategies together and
then see exactly how your portfolio of screens would've performed together.
In the example below, I'm using the Best Buys strategy and the ROE2 strategy for
illustration. In this example, you'll be able to see how two great strategies
working together create an even greater portfolio. When one strategy pulls
back, the other one outperforms – serving to minimize drawdowns and strengthen
returns.
|
|
|
View the Combo performance separately or with the individual strategies
overlayed on top. Whichever you choose, you’ll see how your portfolio would’ve
performed so you can make better decisions.
Here's another example: this one uses ROE2 strategy again along with the price
momentum screen Big Money.
These two strategies have great synergy. When one slows down, the other one
seemingly steps up and vice versa. As you can see, the returns on each are
phenomenal. But the combination of both together (green line), smoothes out the
performance and reduces its volatility and risk.
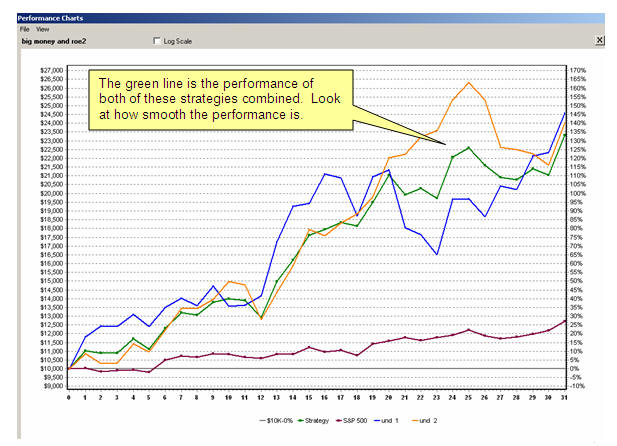
The Big Money strategy in this example showed a 145.5% total compounded return
with a 22.6% maximum drawdown. The ROE2 strategy showed a 147.3% return with a
-13.8% maximum drawdown. The combo strategy (both strategies traded together in
one portfolio), performed very similarly in re: to returns, coming in at 133%.
But the complimentary performance reduced the maximum drawdown to only -8%. A
great return with even less risk.
|
Of course, not every combination of strategies will supercharge your portfolio.
Some will do worse. But that's why backtesting is so important.
And while the examples shown here use the strategies that come loaded with the
program, you can create and test your own screens and combo strategies too.
You can also use the combo backtester is to test for optimum values of certain
items. For instance, let's say you wanted to know what the most profitable P/E
ratio is: less than 20, between 20 and 50 or greater than 50 and higher. You
can run a test and it'll show you how each set of valuations has performed. No
guessing. No wondering. Just hardcore stats. And it's all graphically displayed
for quick analysis.
|
|
|
You can also quickly and easily see how changing an item’s value in a screen (or taking an item out altogether for example -- see below) would impact it. And then you can do a side by side comparison with the original one. And with only a few clicks of the mouse, you can see all of the stats and have it all graphed on a chart for easy decision making.
Creating and testing your stock picking strategies and portfolios has never been easier.
The possibilities are as endless as the profit potential is limitless.
This changes everything!
To get started with the advanced backtester, click below to download the database and get started.
|