Home Download Software Advanced Backtesting Download Databases Tips and Tricks Community

   
Quickly Find Stocks That Will Make You Money

Welcome to the Research Wizard screening and backtesting software from Zacks Investment Research. It's as powerful as it is easy to use. Read through the descriptions below or see it in action with our online videos. Either way, you'll see how the Research Wizard picks winning stocks in any market and how you can too.

Zacks has been providing investment research to professional investors, brokerage houses and individual investors for decades. The cornerstone of Zacks' research is the Zacks Rank, a highly successful and consistent model that uses earnings estimate revisions to predict short term success.

Since 1988, stocks with a Zacks #1 Rank or "Strong Buy" recommendation have earned an average annual return of 26.1%! That's not one good year, or one good quarter. The Zacks Rank has tripled the return of the S&P by posting market-beating gains year after year.

But with over 200 stocks Ranked a #1 at any given time (and over 8,800 stocks in our Universe of companies), there needs to be a reliable way to pick the best companies to buy, quickly and easily. That's where screening and backtesting comes in. A good screening tool can take everything you like in a good stock, and help you narrow down the choices to just the best ones. And with backtesting, you can know in advance which companies have the highest probability of making money.


View a step-by-step Stock Screening demonstration!
View a step-by-step Backtesting demonstration!


One of the many proven, profitable strategies that come loaded with the program.
(CLICK FOR FULL SIZE IMAGE)

 
Start With Our Profitable Strategies


It couldn't be easier to start screening with the Research Wizard. The program comes loaded with some of our most successful stock picking strategies. Most of these start with the Zacks Rank, and then use additional criteria to narrow the list down to a handful of the most promising stock.

Top Ten Screening StrategiesThe Research Wizard comes with dozens of strategies that have performed in both up markets and down markets! You've read about some of these in our popular 'Screen of the Week' articles. Now you can get them all, already created for you, in the Research Wizard.

To find which pre-built strategy matches your investing style, download the free guide, Top 10 Stock Screening Strategies That Make Money.

 
Create Your Own Screens


The Research Wizard is easy to use, but it's not just for beginners. You can use our built in strategies or create you own. Screen with over 650 different fundamental data items on over 8,800 stocks. And create an unlimited number of customized items and calculations in our 'Calculation Expression' feature. Virtually anything you want to look for, you can ask the Research Wizard to find and have your answer within seconds. And once your screens and reports are created, they can then be saved for 'one-click' access for next time.

Research Wizard displays results in an easy to read format which can quickly and easily be sorted according to your preferences. It can even be exported to other applications such as Excel.

You'll then have your own set of customized management tools for picking stocks and monitoring your portfolio(s), all readily available and automatically updated daily. View a step-by-step demonstration!

And with a click of a button, you can access our Zacks Company Snapshots, Equity Research Reports and do all of your charting without ever having to leave the program. In fact, every time you run a screen, it automatically creates a ticker list of all of your stocks so you with a simple click of the mouse, you can flip thru all of your stock charts.
 

Backtesting
See how good your strategies are before you trade

With backtesting, you can know definitively how effective your stock picking strategy is...BEFORE you place your next trade. The Research Wizard tests your strategy and gives you its historical performance. This report shows a summary of your strategy and compares it against the S&P 500 (or Dow Jones or Nasdaq), showing you the number of stocks traded, its historical returns and what your strategy would have bought and sold in the past. See the winning percentage of your holding periods, its risk to reward, and how your investment strategy performed in both up markets and down markets! And every test automatically shows your strategy's equity curve (performance chart) so you can quickly and easily see how profitable your screens really are. Click here to see the 'Backtest Details' screenshots. (pdf)

If you're not backtesting, you're just guessing! View a step-by-step demonstration!
 

AdvancednBacktesting                                                                                  
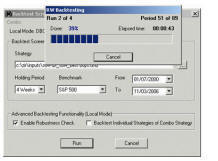
And for advanced users, you can run automated backtesting routines to verify a model's robustness. Do 'combo' backtesting to determine the most profitable parameters of a screen. And even backtest an entire portfolio of strategies (or screen of screens) to see how they act together.

You've got to see to this. This changes everything. You won't find this in any other backtester. But it's all here in the Research Wizard. Click here to learn more.

 
Scan for stocks quickly...
(CLICK FOR FULL SIZE IMAGE)


... and get your list of stocks instantly.

(CLICK FOR FULL SIZE IMAGE)


Pick the screen you'd like to test and see how successful it is at picking winning stocks.
(CLICK FOR FULL SIZE IMAGE)


Combo Screen Chart
(CLICK FOR FULL SIZE IMAGE)


Robustness Analysis Chart
(CLICK FOR FULL SIZE IMAGE)

Stock and Portfolio Ranking with Hot Maps and Scatter Plots

Picking good stocks for your portfolio is one thing, but it's also important to monitor your stocks' attractiveness. With the Hot Map charts in Zacks' Research Wizard software, you can graphically evaluate the attractiveness of stocks in your portfolio and evaluate stocks from your stock screening reports. Stocks are ranked as colors (shades of green for the best to shades of red for the worst) to quickly spot the best and the worst companies without any guesswork.

There's also a Scatter Plot that allows you to plot the linear regression of your selected variables.


Snapshots and Zacks Equity Research

Need to quickly size up a company? Look no further than Research Wizard. The Zacks Company Snapshot Report is a single company report featuring company description, actual and estimated EPS, company vs. industry ratings, fundamental data, broker recommendations and price charts. All of your salient, up to date decision making information in one easy to assess format.

View a sample Snapshot report here.


Hot Maps Chart
(CLICK FOR FULL SIZE IMAGE)


Zacks Snapshots
(CLICK FOR FULL SIZE IMAGE)

,
Expanded Company Reports        

The Research Wizard includes several expanded company reports, displayed in your browser. These reports give you access to Fundamental Data Reports and Tables, Business Description and Management Discussion Reports, Insider Trading Data, Income Statements, Balance Sheets, Cash Flow Tables, Brokerage Research Reports and Abstracts, and more. All on demand at your fingertips.

View actual Statements or 'Standardized' reports for quick and easy comparisons between companies.


Company Report
(CLICK FOR FULL SIZE IMAGE)


Disclaimer: The Zacks Rank performance is the total return of equal weighted simulated portfolios consisting of those stocks with the indicated Zacks Rank net of fees. Results reflect the reinvestment of dividends and other earnings. Simulated results do not represent actual trading and may not reflect the impact that economic and market factors might have had on decision-making if an adviser were actually managing a client's money.

The S&P 500 Index is a well-known, unmanaged index of the prices of 500 large-company common stocks, mainly blue-chip stocks, selected by Standard & Poor's. The S&P 500 Index assumes reinvestment of dividends but does not reflect advisory fees. An investor cannot invest directly in an index.